B.3 Haile Mine Case Study
The mining team would like to acknowledge Paul Eger, Formerly with Minnesota Pollution Control Agency and James J. Gusek, Sovereign Consulting who submitted the Biochemical Reactors Case Study.
B.3.1 Site Information
Contacts
James J. Gusek
Sovereign Consulting, Inc
12687 West Cedar Drive, Suite 305
Lakewood, Colorado 80228
720-524-4908
Name, Location, and Site Description
The Haile Mine site is located in Lancaster County, South Carolina, approximately three miles north of Kershaw in the north central part of the state (Figure B.3-1). Gold has been mined in the region since the early 1800s. With its history dating back to 1827, the Haile Mine is the second oldest significant gold mine in the southeastern United States. Historical mining began with the recovery of placer gold from the gravel deposits of Haile Gold Mine Creek and advanced into small open pits during the 1830s and 1840s. Haile produced sulfur for explosives and medicines during the civil war until portions of the mine buildings were burned to the ground in 1865 by Union forces under General Sherman’s command. Intermittent gold mining continued from 1870 through 1942, at which time open pits were expanded and localized underground workings were developed (Golder 2004).
Modern open pit mining and heap leach gold recovery resumed in 1984 and ceased in 1992. Since then, various site reclamation activities have successfully reclaimed both modern facilities and historical mining features that predate the first modern-day production in 1985. These reclamation/closure activities include backfilling depleted open pits and capping rock dumps.
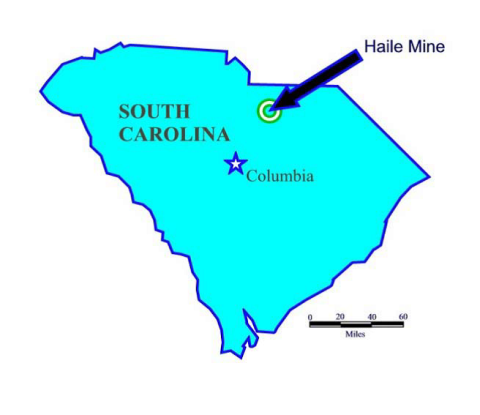
Figure B.3-1. Location of Haile Mine, South Carolina, USA
Following the latest episode of site closure work, mining-influenced water (MIW) requiring treatment originated from three sources (see Figure B.3-2):
- A backfilled and capped Chase Hill open pit with drainage of about 19 liters per minute (L/min) [5 gpm],
- The closed South Heap Leach Pad (South Pad), which was capped in 2000, with an MIW flow ranging from 0.15 L/m (0.04 gpm) to about 1.9 L/m (0.5 gpm), and
- The closed Chase Hill Pad was re-graded and capped with compacted clay in 1999 which was upgraded to a geomembrane system in 2005. A peak MIW flow of 0.76 L/min (0.2 gpm) or less and periods of near zero flow associated with dry periods is expected.
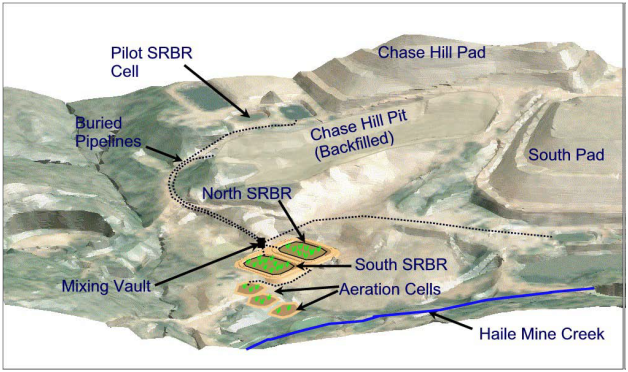
Figure B.3-2. Proximity of reclaimed mining areas in relation to as-built SRBR system layout.
B.3.2 Mining-influenced Water Chemistry
The water quality of flows from the Chase Hill Pit, Chase Hill Pad, and South Pad is shown in Table 1; flow rates vary among the water sources. Table 1 also presents the projected values for selected water quality parameters after mixing the three sources into a combined water sample. These estimated values were based on a weighted-average calculation. The individual weighting was proportional to the projected flow rate from the given MIW source. The actual combined concentrations of the various parameters in Table B.3-1 reflect the beneficial effects of implementing acidic MIW prevention measures such as capping of net acidic mine wastes and backfilling pits. Updated data from individual MIW sources is not available but it is suspected that the mass contribution from the Chase Hill Pad was significantly reducedIn chemistry, having gained electrons. Often gaining electrons is accompanied with gaining protons (hydrogen). As an example, when O₂ reacts with H₂, the oxygen is reduced, forming H₂O. when a geomembrane cap was installed over it, coincidentally completed when the passive treatment system was commissioned.
|
Parameter |
Closed South Pad |
Closed Chase Hill Pit |
Closed Chase Hill Pad |
Estimated Combined Flow into SRBR System |
Actual Combined Influent Chemistry (4.5 yr average) |
|---|---|---|---|---|---|
|
Flow, L/min |
1.9 |
18.9 |
0.76 |
22 |
22.1 |
|
Flow, gpm |
0.5 |
5.0 |
0.2 |
5.7 |
5.6 |
|
pH |
4.9 |
3.65 |
2.0 |
3.3 |
3.4 |
|
Fe, mg/L |
1,290 |
60 |
11,000 |
552 |
96 |
|
Cu, mg/L |
2.00 |
0.3 |
18 |
1.1 |
0.22 |
|
Zn, mg/L |
2.4 |
0.5 |
37 |
1.9 |
1.8 |
|
As, mg/L |
0.0 |
0.0 |
100 |
3.5 |
0.09 |
|
Ni, mg/L |
2.3 |
0.16 |
16.7 |
0.9 |
No data |
|
Co, mg/L |
0.0 |
0.0 |
13.30 |
0.5 |
No data |
|
Al, mg/L |
539 |
17 |
1,700 |
122 |
24.7 |
|
Mn, mg/L |
- |
- |
- |
5.9 |
2.8 |
|
Sulfate mg/L |
30,000 |
750 |
30,000 |
4,342 |
554 |
|
Acidity mg/L |
6,830 |
195 |
35,000 |
1,998 |
387 |
|
Alkalinity mg/L |
0 |
0 |
0 |
0 |
0 |
B.3.3 System Design
Design of the passive SRBR system was based on the performance of a 2.5 year pilot-scale test and was further supported by two supplemental bench-scale studies. The design was developed in accordance with established engineering protocols; the construction was authorized under the Construction Permit 18,873-IW issued on June 15, 2004 by the South Carolina Department of Environmental Control.
A schematic of the system is provided on Figure B.3-3. Note that the vegetation drawn on the surfaces of the two SRBRs is slightly different. The South SRBR plant community is dominated by willows (Salix); the North SRBR plant community appears to be dominated by cattails (Typha). These supposedly minor differences may account for significant variations in the relative performance of the two SRBRs. The colonization by neither of these two plant communities was intentional; their establishment occurred on a volunteer basis.
The pilot sulfate reducing bioreactor (SRBR)An engineered treatment system that uses an organic substrate to create sulfate reducing conditions and drive microbial and chemical reactions to reduce concentration of metals, acidity, and sulfate in mining-influenced water. cellAn individual unit in a treatment system. test results (Golder 2004) demonstrated that the system has resiliency during extended periods of overloading. In the 4.5 years of actual operation, the system does not appear to have been exposed to overloading conditions. If anything, the system appears to be under-loaded with respect to its design conditions as suggested in Table B.3-2 and subsequent performance data.
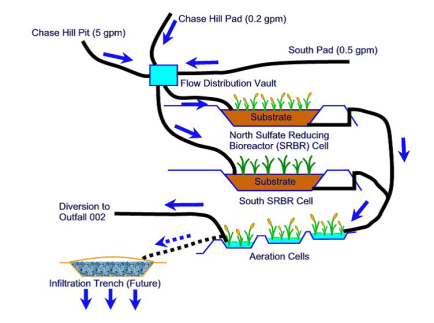
Figure B.3-3. System schematic layout
B.3.4 BCR Design
The design objectives of the SRBR cells included accommodating and managing about 22.7 L/min (6 gpm) of combined MIW flow, operating continually without pumps and allowing periodic (multiple decade) major maintenance operations. The SRBR cell design criteria were established in bench- and pilot-scale tests. These include satisfying a volumetric metal loadingMass of something per time entering a volume (volumetric loading rate) or flowing into an area (areal loading rate). factor of 0.3 moles of metal loading per day per cubic meter of organic substrateEither (a) a chemical which reacts or (b) a solid surface or (c) an electron donor. (Wildeman et al. 1993), and a bottom area hydraulic loading factor of about 87.2 m2 per L/min (3,550 square feet per gpm) of flow based on the findings of bench and pilot studies (Golder 2004). Installing just 0.915 m (3 ft) of organic substrate would have satisfied the metal loading design criteria. To be conservative and to prolong the interval between major SRBR retrofitting/substrate replacement, the actual installed organic substrate thickness was 1.68 m (5.5 ft). Thus, if the design water chemistry and design flow rates were maintained, the volumetric loading “as-built” would be about 0.16 moles of metal/day/m3. Design issues typically included in SRBR based systems are discussed in Gusek (2002).
The ratio of components in the organic substrate mixture as cited in Golder 2004 was changed just prior to construction in response to localized procurement shortages. The final substrate mixture is provided in Table B.3-2.
|
Mixture |
Cubic Meters |
Mixing Ratio |
|
|---|---|---|---|
|
Material |
|
||
|
Aged Chipped Wood |
184 |
or |
20 buckets at 9.2 m3/bucket |
|
Manure |
9 |
or |
1 bucket at 9.2 m3/bucket |
|
Agricultural Limestone |
14 |
or |
6 buckets at 2.3 m3/bucket |
|
Hay / Alfalfa (bale) |
21 bales |
or |
At 309 kg (680 lbs) per bale |
To minimize earthwork, provide for future maintenance, and conform to the existing surface contours at the proposed site, the SRBR treatment capacity required was allocated equally between two individual cells which were subsequently operated in parallel. Each cell was designed to accommodate a nominal flow of 11.4 L/min (3 gpm); however, as demonstrated in the pilot test program, each cell could handle as much as three times that MIW flow for an extended period with a small decrease in removal efficiency.
Flow through the SRBR cells was arranged to be by gravity from top to bottom. The cells were lined with 60 mil thick linear low density polyethylene (LLDPE) geomembrane. Under typical operating conditions, the organic substrate would be completely submerged beneath a standing pool of water, similar to the operation of the pilot cell.
The water exiting from both SRBR cells is commingled in a buried pipe and conveyed to the uppermost portion of an aerobic polishing cell (APC)A shallow pond which allows for aeration and settling of particles, typically following a BCR.. The APCaerobic polishing cell receives treated effluent from the two SRBR cells. The primary purpose of these units is to:
- provide re-oxygenation
- remove any remaining dissolved ferrous iron
- remove a minor loading stream of dissolved manganese (about 2.8 mg/L)
The APCaerobic polishing cell delivery pipe terminus was equipped with an upturned 90-degree elbow to preclude small animal incursions. The peak flow, ranging from 12.1 to 28.4 L/min. (3.2 to 7.5 gpm), is so small that beavers known to live in nearby natural drainages have not been attracted to the location.
Construction began in late October, 2004, and was substantially complete by April, 2005; monitoring of the system commenced in May, 2005. Photos of the North and South SRBR cells are provided in Figure B.3-4 and B.3-5, respectively.
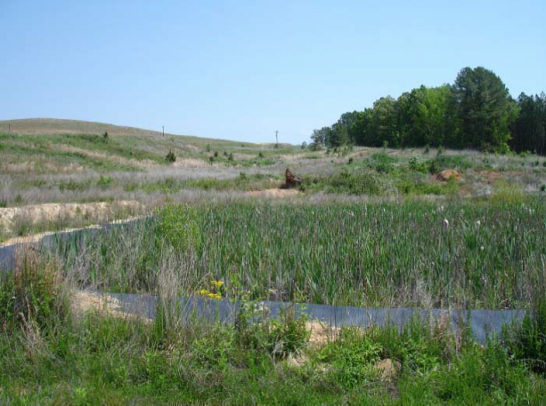
Figure B.3-4. North SRBR (April 2008) showing cattail (Typha sp.) as major vegetation.

Figure B.3-5. South SRBR (April 2008), showing willow (Salix sp.) as major vegetation.
B.3.5 BCR Performance
Since 2004, the Haile Mine passive SRBR system has functioned 24 hours a day, seven days a week without sustained interruptions. SRBR and APCaerobic polishing cell performance data are shown for Figures 6 through 13. Discussions of individual parameters of interest follow.
Previously, it was noted that the SRBRs were designed for about 0.16 moles of metal removal per day per cubic meter of substrate, significantly less than the benchmark value of 0.3 moles/day/m3. The data plotted on Figure B.3-6 show that both SRBRs were not excessively loaded with respect to metals during the five years of operation and that sulfate removal more or less kept pace with metals removal.
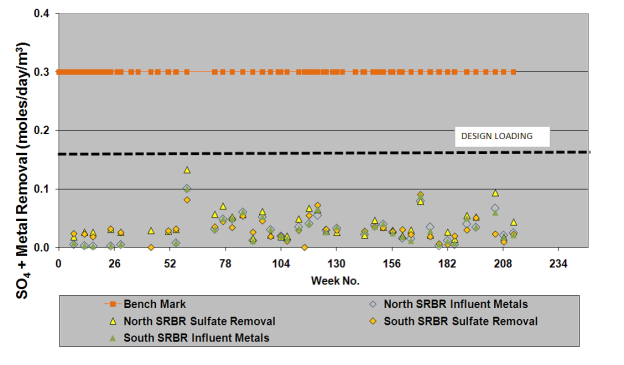
Figure B.3-6. Volumetric sulfate and metal loading/removal.
B.3.5.1 pH Improvement
The data in Figure B.3-7 suggest that the pH improvements were relatively insensitive to seasonal changes for the five years the SRBR system has been in operation. The rise in Aeration Cell pH compared to either of the SRBR cell effluents would suggest that excess alkalinity in the SRBR effluent (typically about 800 mg/L for the SRBR) provided a consistent buffering effect. In comparison, the average net alkalinity in the Aeration Cell was about 583 mg/L.
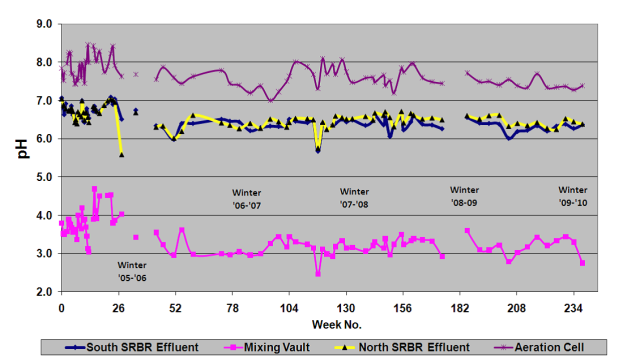
Figure B.3-7. pH.
B.3.5.2 Oxidation Reduction Potential (ORP)
Once the noisy ORP data from the first few months is filtered from Figure B.3-8, it is apparent that the North and South SRBR ORP data typically agree. With minor exceptions, ORP is usually negative which is indicative of robust geochemically reducing conditionsA system in which the gain of electrons is energetically favored due to a low reduction potential.. It is curious to note that the Mixing Vault ORP values decrease over time, suggesting that the mitigation measures implemented at the Haile Mine (such as capping or re-vegetation) appear to be decreasing the oxidation kineticsThe study of rates of reaction. in the mine waste zones that the MIW contacts prior to entering the SRBR system. The typically depressed ORP in the Aeration Cell effluent suggests that the APCaerobic polishing cell component of the system is being stressed. Future designs for aeration cells would probably result in larger footprints.
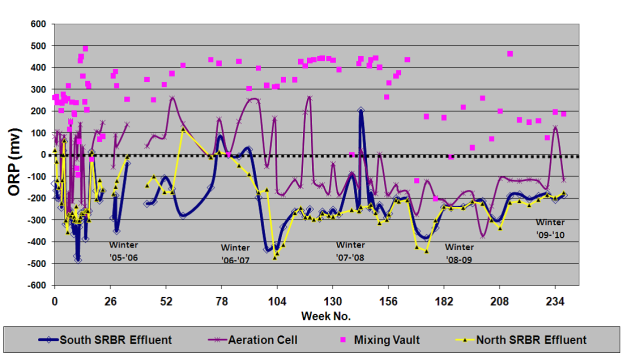
Figure B.3-8. Oxidation reduction potential (ORP).
B.3.5.3 Dissolved Iron
As plotted in Figure B.3-9, dissolved iron removal in the North and South SRBRs was virtually identical for weeks 0 through 84, which coincides with the spring of 2007. At this point, the behavior of the two SRBRs diverges, and the dissolved iron removal performance of the South 427 SRBR appears to become worse over time. It is curious that the North SRBR appears to have had a similar excursion in about week 182, just prior to the onset of the 2008-09 winter.
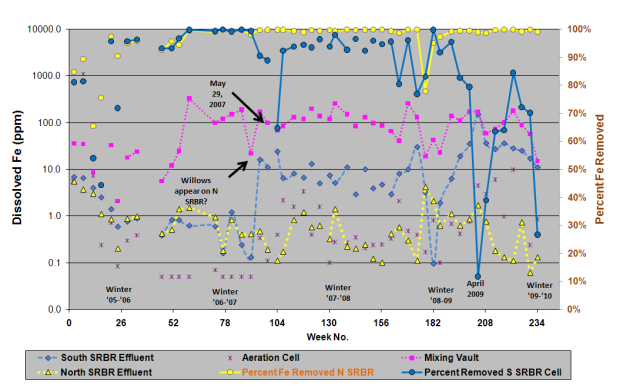
Figure B.3-9. Dissolved iron.
Based on recollections from site personnel, it appears that willows first appeared on the surface of the South SRBR in the spring of 2007, which coincides with the drop in the South SRBR iron removal performance. Similar excursions appear to occur with a somewhat inconsistent regularity when the seasons change. The current hypothesis is that the ORP conditions on the surface of the South SRBR are changing in response to the dormancy or spring emergence of the willow community with the changing seasons. For example, in the autumn, when dormancy begins, oxidizing conditions typically surrounding the plant roots may become reducing. Any iron oxy-hydroxide that had been precipitated in this zone would likely be re-dissolved in the reducing conditions, creating a temporary spike in iron concentration in the SRBR effluent as Fe2+ iron. During the winter, reducing conditions would continue to prevail and ferrous iron would likely be removed in response to bacterial sulfate reductionThe stripping of oxygen atoms from sulfate (SO₄²⁻), most often yielding sulfide (S²⁻) as an ultimate product. as iron sulfide. In the spring, when the willows are no longer dormant, the iron sulfide precipitates would now be exposed to oxidizing conditions in the willow root zone and again, iron would be released when the sulfides were oxidized. This phenomenon was first observed in the iron removal data for the lime dosed aerobic cell in the Wheal Jane passive treatment system as reported by Hamilton et al. (1997). Similar spikes were observed in December of 1995 and the following spring of 1996. This aerobic cell was planted with three species of plants: Typha, Phragmites, and Scirpus.
One might expect to see a coincidental spike in arsenic in the South SRBR effluent but none was detected. Mixing Vault arsenic levels ranged from 0.007 to 0.39 mg/L and both South and North SRBR effluents consistently exhibited arsenic concentrations less than the detection limit of 0.005 mg/L.
B.3.5.4 Dissolved Copper
As plotted in Figure B.3-10, dissolved copper removal in the North and South SRBRs (plotted cumulatively) appears to coincide with the iron removal anomalies identified in Figure B.3-9. However, these “false” anomalies are attributable to depressed copper levels in the Mixing Vault and the nearly constant analytical detection limit for Cu of 0.01 mg/L. For example, the Mixing Vault copper concentration on Oct 28, 2008 was only 0.029 mg/L. With a detection limit of 0.01 mg/L, this results in an apparent removal of only 52.6% [(0.029-0.01)/0.029 = 0.526]. 429.
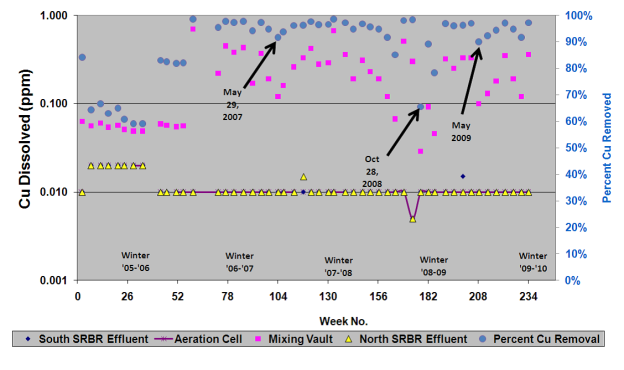
Figure B.3-10. Dissolved copper removal.
B.3.5.5 Dissolved Zinc
A similar masking mathematical influence was observed in a plot of Zn removal, as shown in Figure B.3-11. Consequently, it is concluded that the willows or some other unidentified mechanism is affecting iron removal efficiency; it is not significantly affecting Cu or Zn removal. Neither dissolved Cd removal efficiency (typically about 94%) nor dissolved Al removal efficiency (typically about 97.5%) appeared to vary seasonally in the South SRBR.
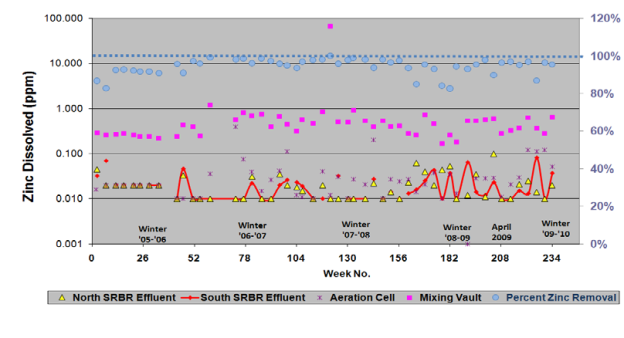
Figure B.3-11. Dissolved zinc removal.
B.3.5.6 Sulfate Reduction
Sulfate removal is naturally a key indicator of the relative “health” of a sulfate reducing bioreactor. Data in Figure B.3-12 reflect a wide scattering of influent sulfate concentrations in the Mixing Vault and relatively consistent effluent concentrations of typically less than 600 mg/L. It is curious to note that the relative difference in sulfate concentration between the influent and the SRBR effluent is about 300 mg/L in the first year of operation. Subsequent yearly peak data suggest differences up to about 900 mg/L. However, when this data is synthesized with volumetric loading, as plotted in Figure B.3-6, the data trends are far less noisy.
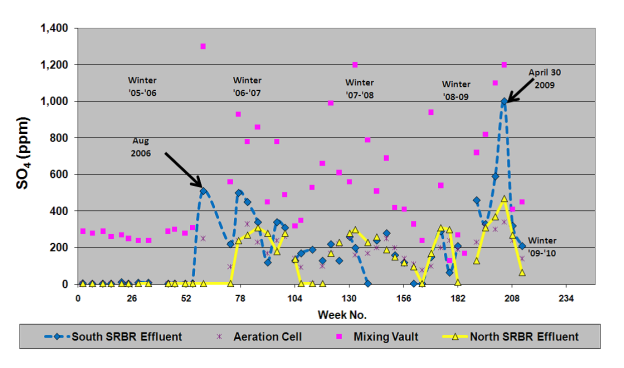
Figure B.3-12. Sulfate removal.
B.3.5.7 Combined Metals Removal Efficiency
A final measure of success of a passive treatment system is the percentage removal of the metals of interest. Figure B.3-13 reflects the relative removal efficiencies of the two SRBRs and the final aeration cell in removing iron, aluminum, copper, zinc, and cadmium. The alkalinity buffering in the SRBR effluent is likely countering the adverse iron performance in the South SRBR to provide its intended polishing effect.
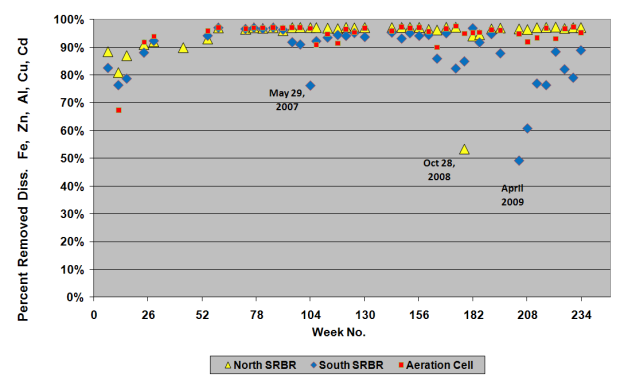
Figure B.3-13. Combined dissolved metals removal efficiency, SRBRs and aeration cell.
B.3.6 Monitoring
Influent and effluent samples were collected about once per month from 2005 to early 2010. All samples were analyzed for pH, EhThe redox potential is the tendency of a compound to gain an electron. This is most often measured as the voltage required to prevent electrons to transfer between the measured sample and a standard reference electrode. For Eh, that standard reference, defined as zero volts, is H2 → 2 H+ + 2 e- at a specified standard condition., conductivity, SO₄, copper, zinc, nickel, cadmium, arsenic, iron, manganese, aluminum and conductivity.
B.3.7 Challenges and Lessons Learned
No regulatory or stakeholder challenges were reported. Decreased removal of iron in the south SRBR corresponded with the appearance of willows on the top of the cell. Typically vegetation is not encouraged due to concerns with oxygenating the water and decreasing the reducing zone. Vegetation on the north SRBR was dominated by cattails and dissolved iron removal was not affected.
Substrate samples collected from the preceding pilot test showed that concentrations for the parameters of interest were elevated only in the upper portion of the substrate (Table B.3-4)
|
|
Sample Depth (inches) |
Total Metals Concentration (mg/kg) |
% Organic Matter |
% Solids |
|
Sample Depth (inches) |
Total Metals Concentration (mg/kg) |
% Organic Matter |
% Solids |
|
Sample Depth (inches) |
Total Metals Concentration (mg/kg) |
% Organic Matter |
|---|---|---|---|---|---|---|---|---|---|---|---|---|---|
|
|
From |
To |
Al |
As |
Cd |
Ca |
Cu |
Fe |
Mg |
Mn |
Zn |
||
|
Sample |
0 |
6 |
23,300 |
1.08 |
6.37 |
17,300 |
253 |
25,900 |
8,020 |
264 |
844 |
64.3 |
43.4 |
|
Zone 1 |
6 |
12 |
7,680 |
0.89 |
4.39 |
69,200 |
89 |
20,200 |
31,600 |
484 |
915 |
47.1 |
42.6 |
|
|
12 |
18 |
5,280 |
0.92 |
2.23 |
56,000 |
48 |
13,100 |
22,900 |
474 |
458 |
65 |
43.8 |
|
|
18 |
21 |
2,500 |
0.79 |
1.72 |
58,300 |
30 |
6,830 |
23,800 |
469 |
434 |
65.8 |
42.9 |
|
Sample |
0 |
6 |
19,700 |
0.93 |
6.54 |
27,500 |
285 |
36,400 |
13,600 |
245 |
901 |
62.8 |
41.8 |
|
Zone 2 |
6 |
13 |
14,400 |
1.16 |
5.42 |
33,800 |
224 |
32,500 |
16,300 |
340 |
789 |
59.3 |
39.8 |
|
|
13 |
18 |
3,310 |
0.51 |
1.42 |
41,500 |
26 |
13,700 |
17,200 |
359 |
271 |
72.7 |
43.3 |
|
|
18 |
24 |
2,800 |
0.56 |
1.38 |
51,700 |
27 |
10,100 |
20,800 |
351 |
298 |
63.8 |
44.4 |
|
Sample A1 |
|
|
14,900 |
1.38 |
6.83 |
25,500 |
380 |
40,100 |
10,700 |
351 |
969 |
60.8 |
42.3 |
|
Baseline2 |
|
|
9,730 |
5.98 |
3.33 |
60,500 |
53 |
7,380 |
27,300 |
505 |
958 |
78.7 |
84 |
|
Ag Lime |
|
|
|
|
|
185,000 |
|
|
106,000 |
|
|
|
|
|
Notes: 1 Sample A was a composite of the outer 1/2" of substrate in direct contact with the cell sidewall. 2 Unexposed substrate |
|||||||||||||
B.3.8 References
Golder Associates Inc. 2004. Haile Mining Company Inc. Passive Best Management Practice System Design Report, dated February 2004.
Gusek, J.J., 2002. Sulfate-Reducing Bioreactor Design and Operating Issues: Is This the Passive Treatment Technology for Your Mine Drainage? Presented at the National Association of Abandoned Mine Land Programs (Park City, Utah, September 15-18, 2002).
Hamilton, Q.U.I., H.M. Lamb., C. Hallett, and J.A. Proctor, 1997. Passive Treatment Systems for the Remediation of Acid Mine Drainage at Wheal Jane, Cornwall, UK. In: Proceedings of a CIWEM National Conference, (Newcastle University, September 1997), pp. 33-56.
Wildeman, T.R., G.A. Brodie, and J.J. Gusek. 1993. Wetland Design for Mining Operations. Vancouver, B.C.: BiTech Publishing Co.
Publication Date: November 2013